In this article, we will examine how we can find out if a solar power plant produces as much energy as it can, and whether it is well run. One of the features that distinguish solar power plants from other power plants is that accessing production information at energy production points is quite costly. Because of this high cost, there is always uncertainty about whether the production of SPPs is good or not.
Let me explain the subject;
The input of the solar panels, which is the production point in solar power plants, is the solar energy falling on the panel. If we could put one radiation sensor on each panel and get production data from each panel, there would be no uncertainty, we would be able to calculate the energy that the whole plant should have produced with simple mathematical formulas.
The high cost of accessing this production information and the need to eliminate uncertainties in the power plant are the main reasons for the development of Solarify.
Solarify's artificial intelligence learns the production points in your power plant according to the reference radiation values and creates a model and predicts the required energy production with 98% accuracy through this model. This modeling, when used in conjunction with an interactive ticketing system, shows how a plant is managed and whether it actually produces as much energy as it should. What do we need first?
1.  Solarify is running at the power plant
2.  At least 1 radiation sensor in your plant
3.  Entering the simulation report of the plant including monthly production, radiation, and ambient temperature into the system
4.  Active use of an interactive ticketing system
5.  Tracking spare parts movements in the plant with the Solarify system
It's easy to get Solarify up and running in your solar power plant. Solarify, which can work with almost * all inverter, analyzer, and sensor brands, is installed in a power plant as easy as subscribing to a social media site.
Solarify is compatible with Tescom Solar, Siemens Kaco, Fimer-ABB, Solo, WStech Fronius, Goodwe, Kostal, Delta, SMA, Sungrow, Refusol, Huawei, and inverters.
In our opinion, the radiation sensor is very cost-effective and very important reference equipment that should have at least one in all solar power plants. Solarify Data Loggers can communicate with all radiation sensors communicating with Modbus.
Regarding the simulation report, you may need to consult with your EPC who established the solar power plant. If you do not have it, you can still have it done in accordance with the plant. You can enter the information in the simulation report from the simulation settings area in Solarify's settings tab.

As our teammate, Hazal Demirok explains in the webinar (in Turkish), it is necessary to use the interactive ticketing system for the consistency of the monthly performance report. Finally, on the spare parts tracking page on the settings page, entering the status of the spare parts in the power plant will enable these movements to be seen in the monthly report. We can access all reports (ticket reports, custom reports, and monthly performance reports) produced by Solarify from the reports tab. Let's access the report prepared for the Demo power plant from this menu.

Let's get to the content of our report: Our monthly report consists of 13 main titles, the first 5 items of the titles I listed below address the content of this article directly.
1. SPP monthly budgeted and actual production
2. SPP daily PR and availability
3. SPP performance calculations - real production
4. SPP performance calculations - budgeted production
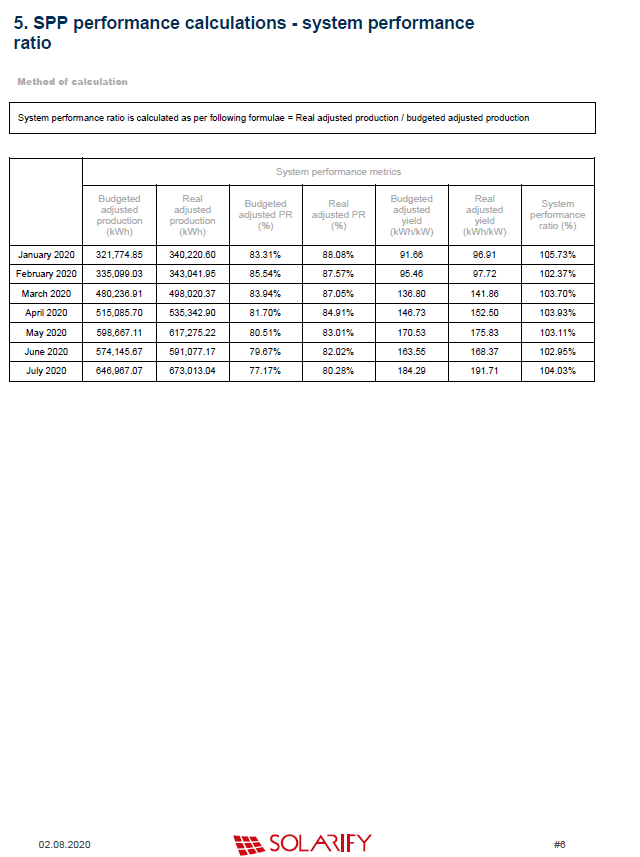
5. SPP performance calculations - system performance ratio
6. SPV daily PR
7. SPV daily yield
8. SPV daily energy
9. Scheduled monthly inspection plan
10. List of tickets that are closed this month
11. List of tickets that are open
12. List of spare parts
13. Comments & Notes
Let's examine the first page;
The actual production value shown on this page is raw data and shows how much energy our plant produces according to the planned generation regardless of weather conditions. Thus, the solar power plant investor can see how well his financial expectations are met.

On the second-page, we see how our 3 important metrics are progressing during the month.

PR: Performance ratio, the performance ratio calculated according to IEC 61724-1 describes how much of the energy can be obtained from the radiation energy falling on a power plant.
TPR: The performance ratio reflected by the temperature effect takes a more accurate approach to the calculation of the performance ratio and removes the air temperature difference from the calculation. In this way, it becomes easier to compare different plants.
Availability: It is the unit that explains how many times a plant can operate. We mentioned it in detail in our article.
On the third page; we are solving an important problem, especially in operation and maintenance works.
When the Solarify interactive business management system is used, outages that are or are not within the scope of operation and maintenance are separated. For example, after snow falls on your solar power plant, when it starts to melt, the snow on the irradiation sensor melts faster. This situation causes the panels to remain profitable and the performance ratio to decrease. Solarify calculates the energy lost (using the TPR formula) and adds this to the energy generated in the content of the report at the end of the month, as the performance ratio should not be affected in this case.
Similarly, when there is a network-related outage when the operation and maintenance system is used correctly, Solarify adds these losses to the performance report at the end of the month, and a new performance ratio emerges, which is the responsibility of the operation and maintenance service. We got the production values correctly, now we need to get the simulation values correctly so that we can compare.
When calculating the raw simulation energy production data, it calculates many variables belonging to the solar power plant. Among these variables, there are 3 critical variables that change over time and that we can measure. Irradiance, module temperature, and age of the panels.

On the fourth page, the raw simulation energy generation data is updated to take into account the difference between the first incident radiation and the simulated radiation. Accordingly, if the actual radiation is greater than that simulated, the simulated energy production must also increase. In the second step, the difference between the actual module temperature and the simulated module temperature is reflected in energy production. Finally, according to the panel type and the age of the plant, the panel distortion rate is calculated and added to the simulation value. After all, if the simulation was made for a power plant built in 2015, we cannot expect the same results in 2020.
When all these calculations are completed, a new simulated performance ratio emerges.

On the 5th and last page, the performance ratios we found on pages 4 and 3 are compared and a system performance rate is calculated, thus actually showing the state of our power plant according to this simulation. The system performance rate metric on this page gives a good metric about how well your power plant operates.