Analysis
The analysis page allows you to graph the data of the devices connected to the system and the created terms with a maximum of 4 different axes (units), and display the data you want in the daily, weekly, monthly or yearly format and export with the .xlsx extension.
New Analysis
- Click on the new analysis button to create the analysis.
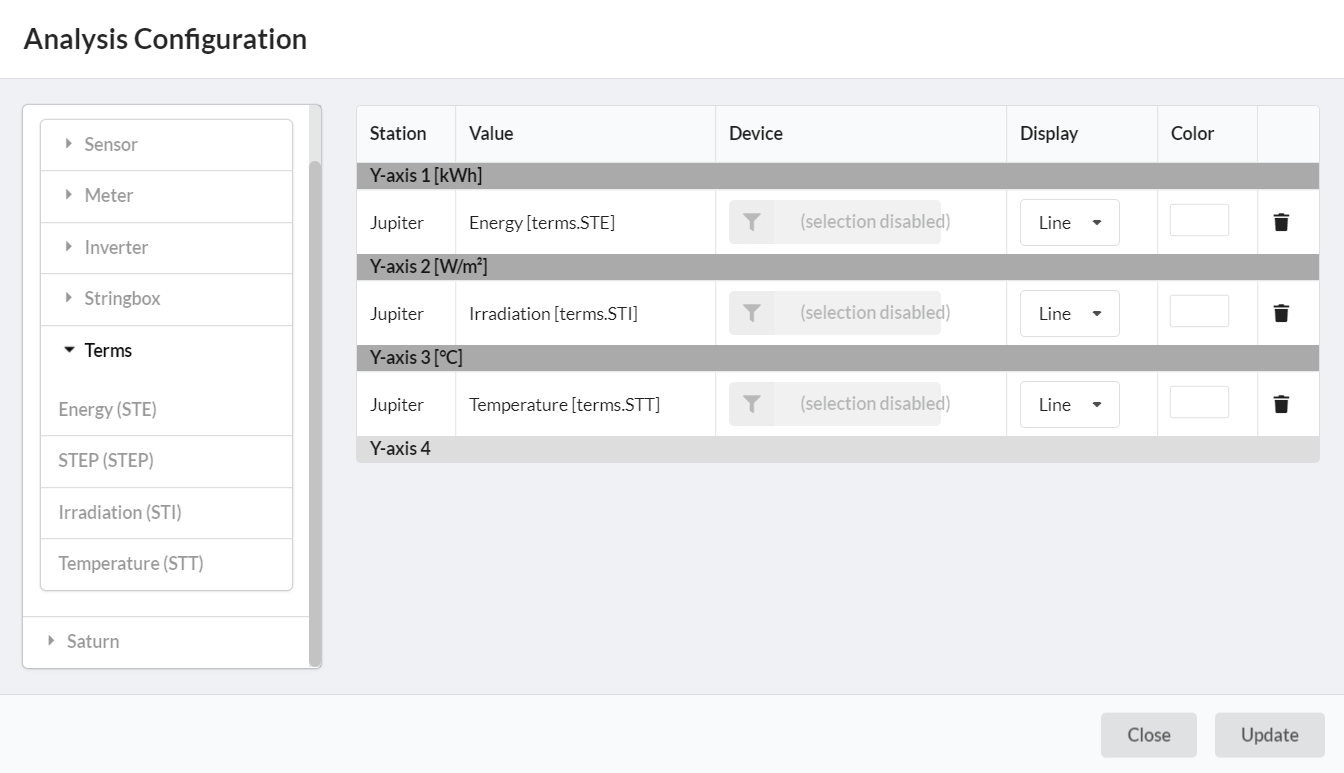
- The station name is selected on the left.
- After selecting the station name, the value is selected.
- It is specified for which device to analyze.
- Chart type is selected. Which color to draw the graphic is selected.
- Clicking the Update button opens the following page.
-
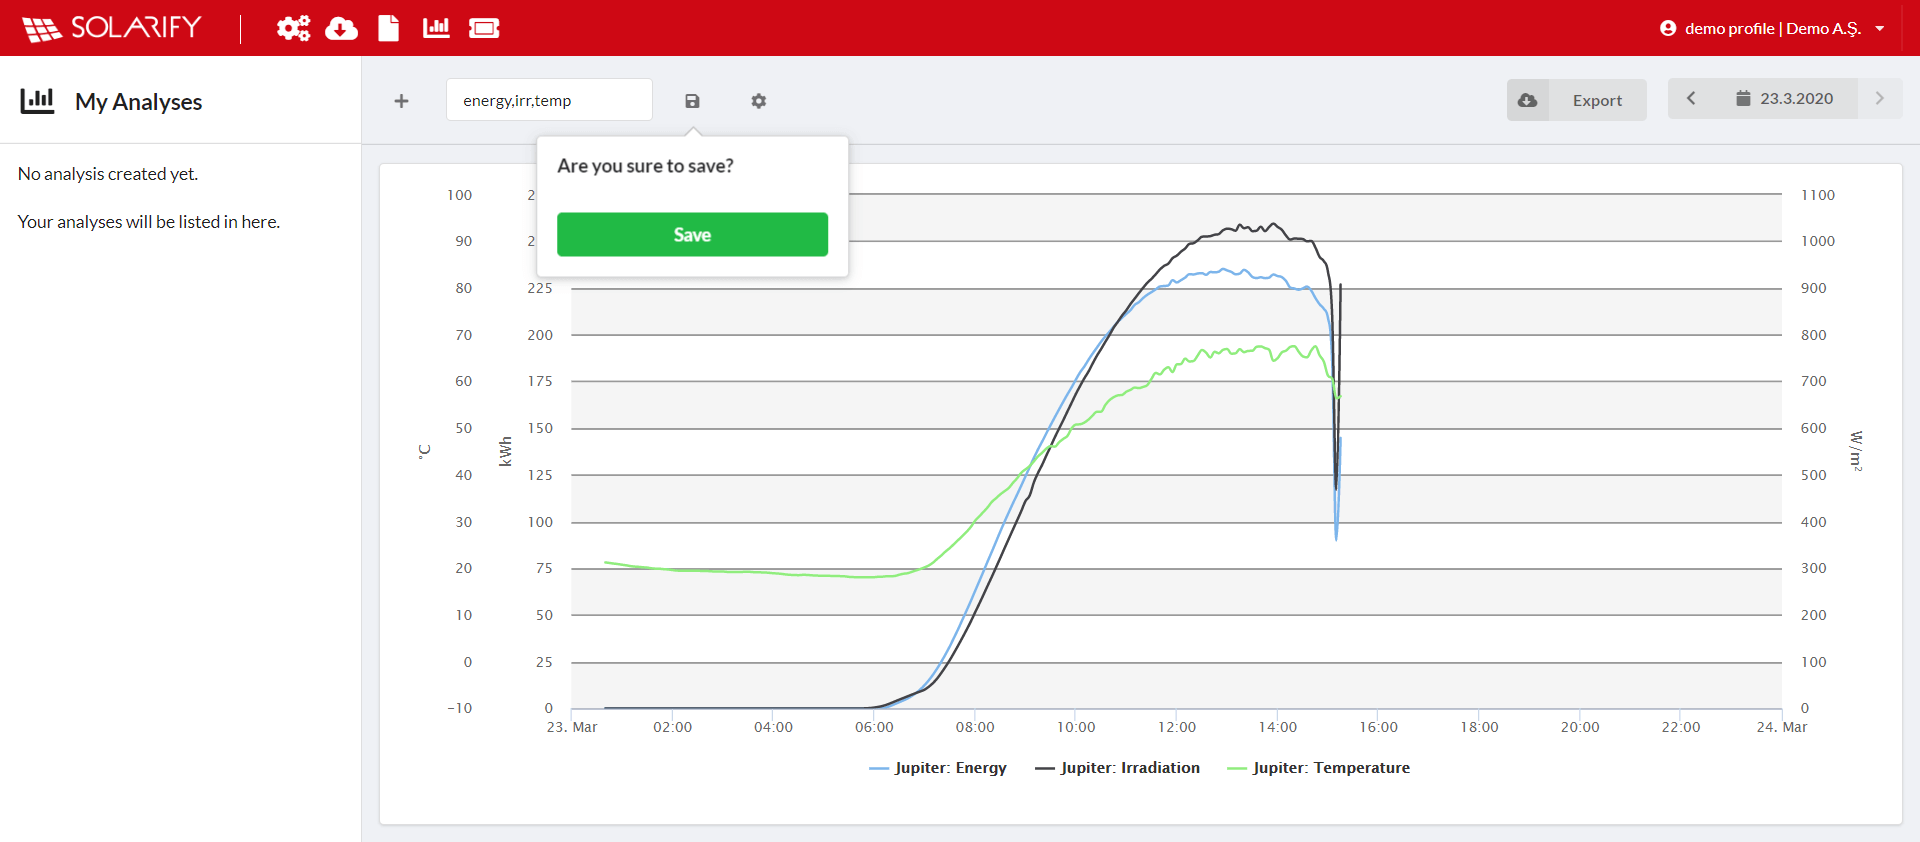
The created graph is given a name from the top left and click on the save button.
-
If desired, the created analyzes can be added to the pages tab and viewed.