AI Analysis
It is an artificial intelligence-based analysis page.
Predicted Production Chart
It gives the predicted production values as a result of the monitoring made by the artificial intelligence. From the graph, it is observed how much the station should produce and what it can produce with deviation percentage.
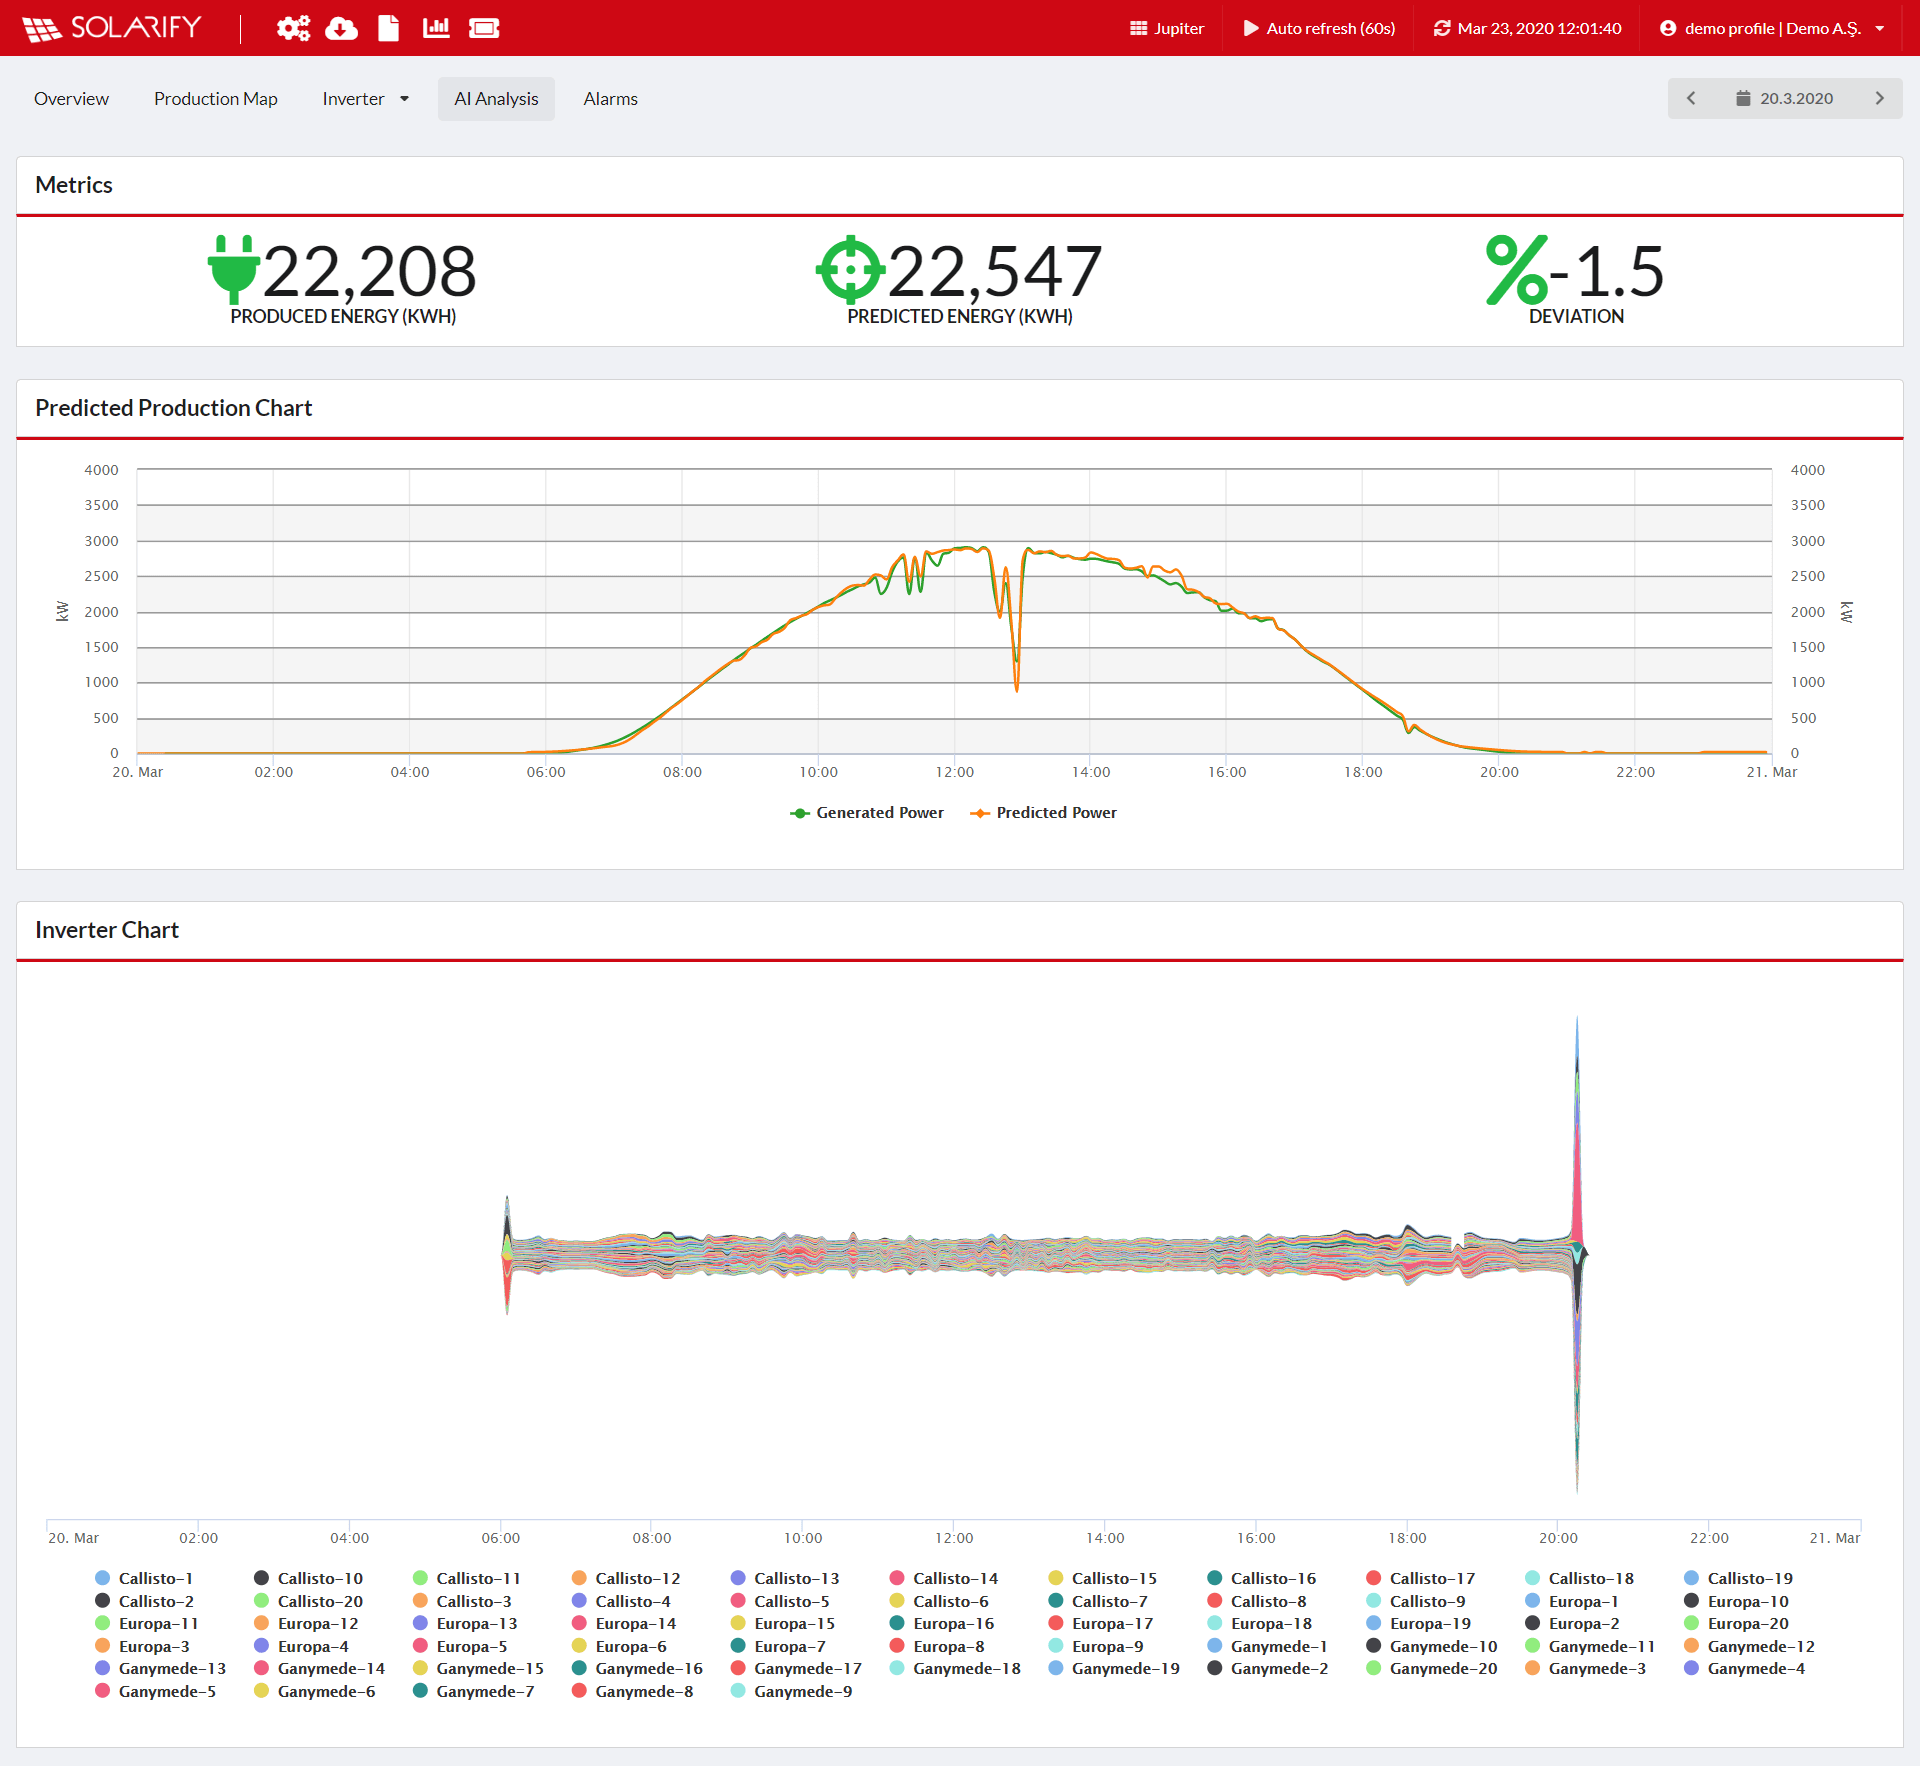
Inverter Chart
The inverter graph shows the ratio between the energy produced and estimated energy for each inverter. The zero point is located horizontally in the middle of the graph. The closer the values read in the graph to 1, the closer the produced and estimated energy values. Observations can be made by selecting one or more inverters from the list below.