String
It is the page that allows you to read and compare the current of the plants with string inverters or stringboxes in the range of data frequency sent by the data logger.
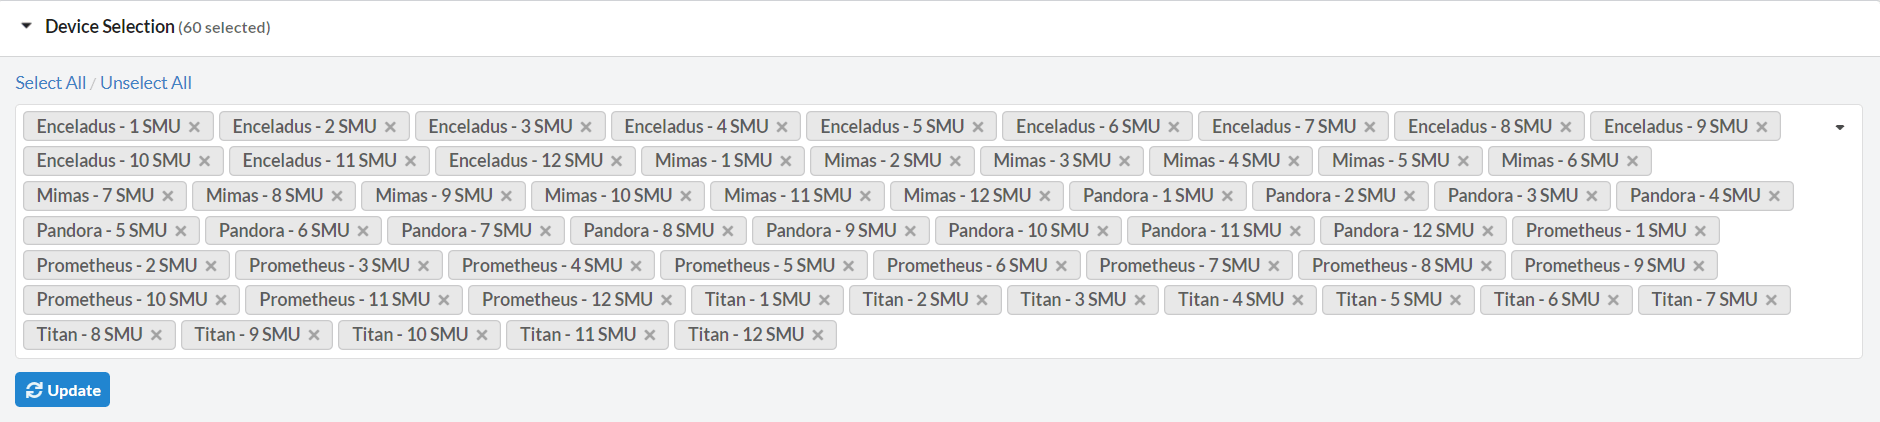
The devices whose string currents are to be observed are selected from the 'Device Selection' section and the update button is clicked.
String Currents
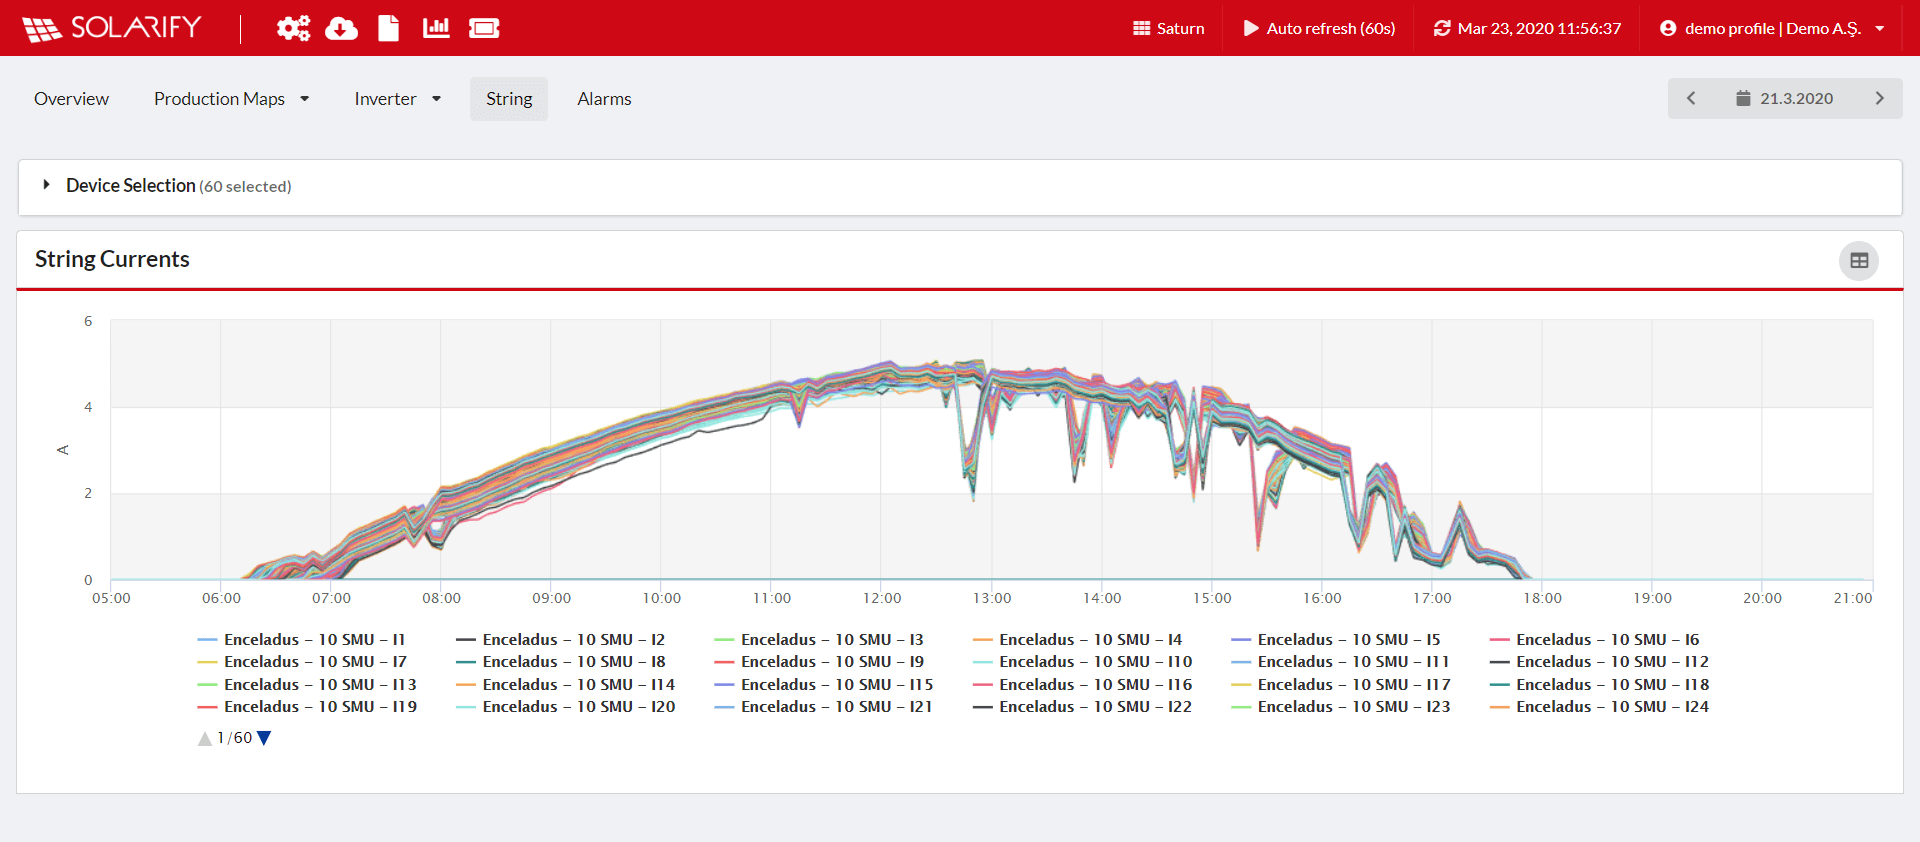
Current values for each string of selected inverters can be read on the graph. You can change the number of strings displayed on the chart by clicking on the string names below the chart.
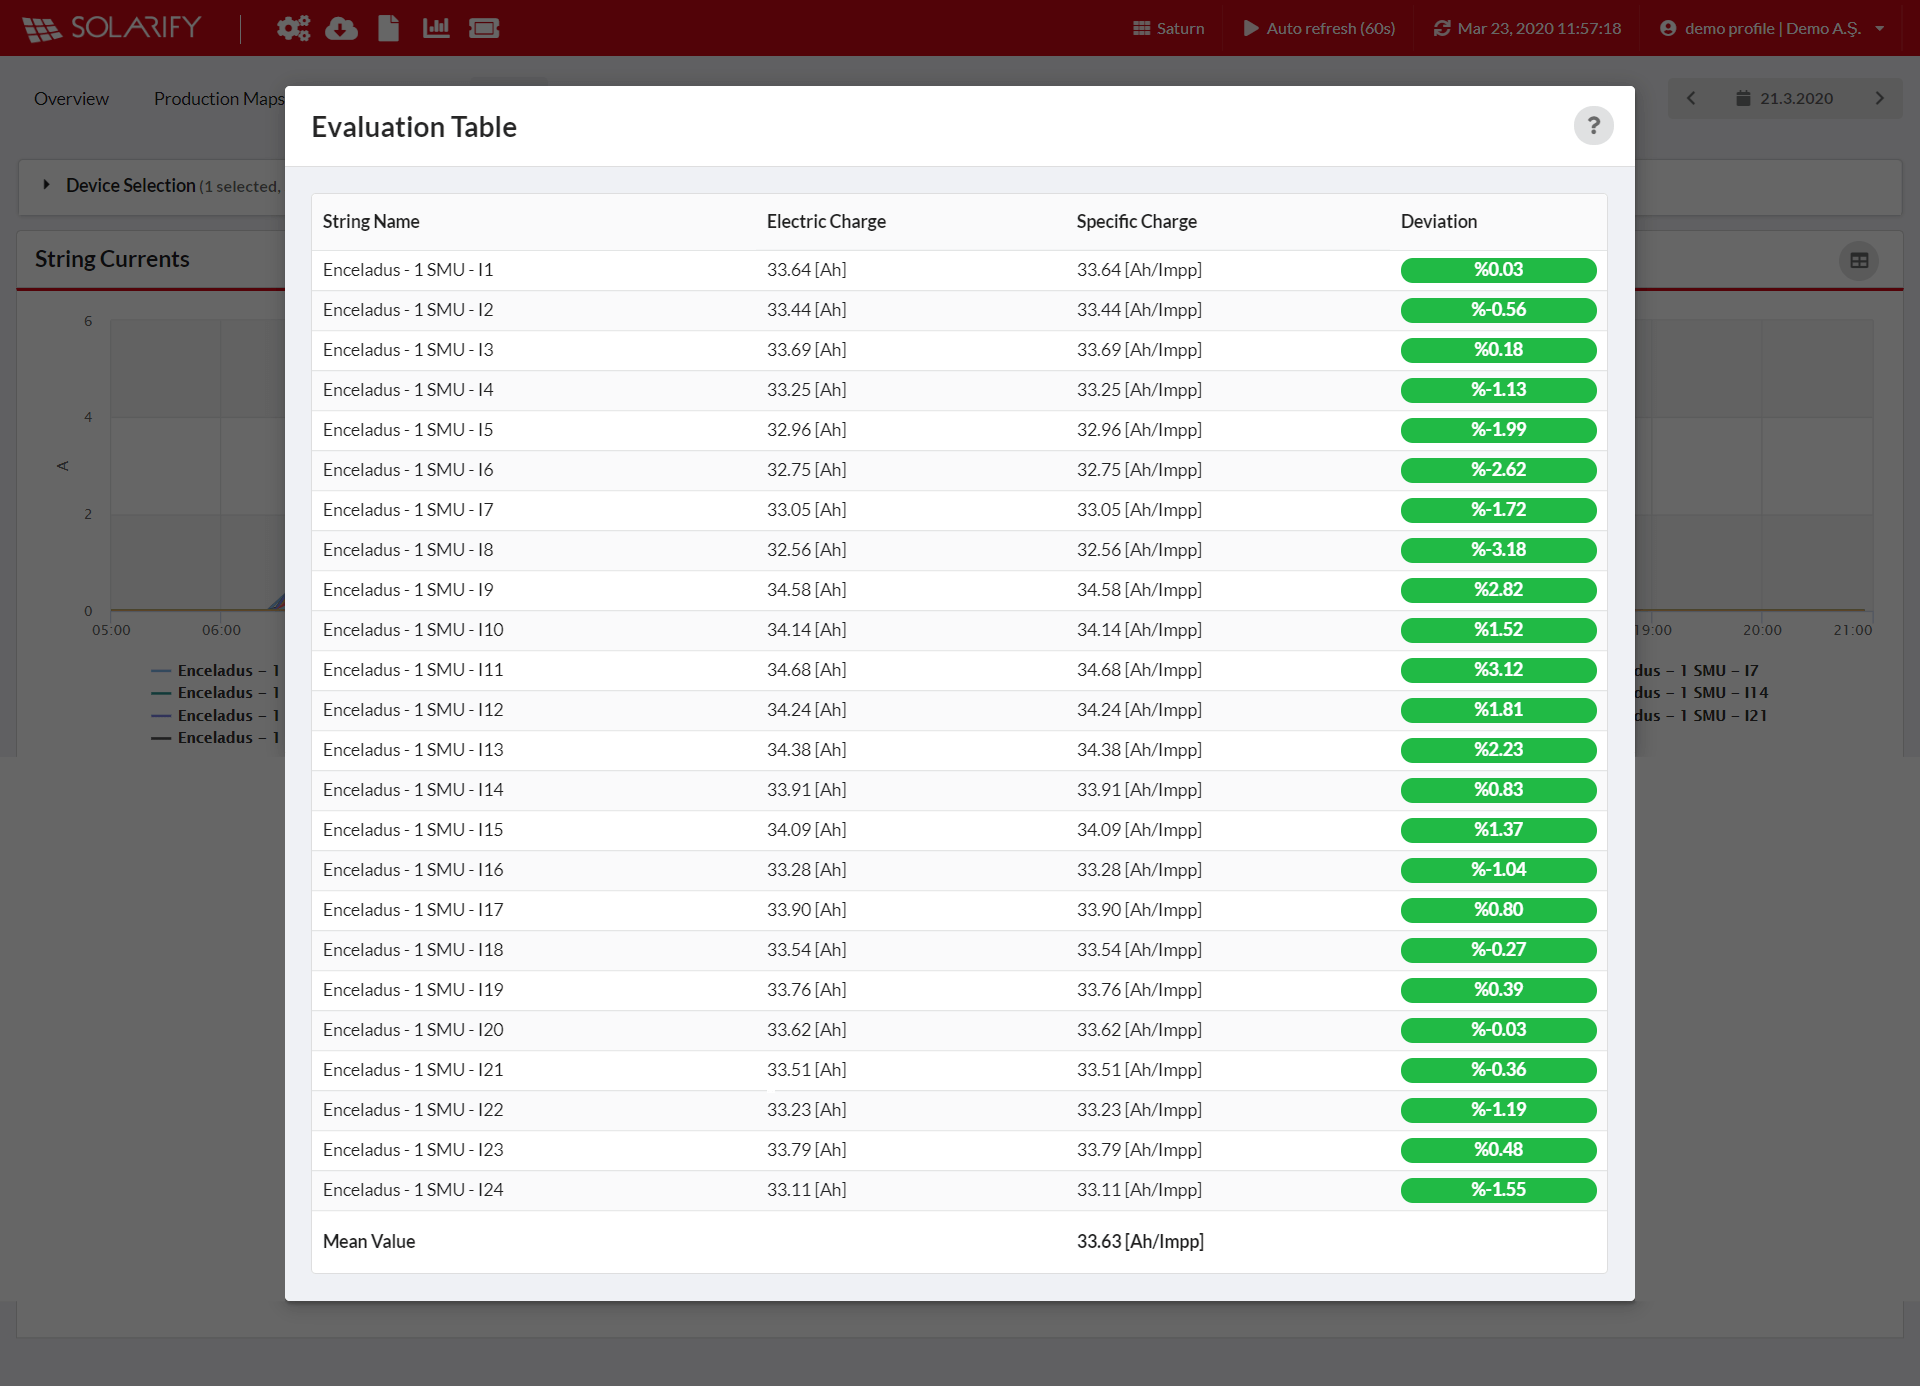
Evaluation Table
![]() By clicking this icon in the upper right corner of the graph, you can observe the comparison between the current produced in the strings of the devices you choose from the device selection and the current at the maximum power point and how many percent (%) deviation from the average is colored.
By clicking this icon in the upper right corner of the graph, you can observe the comparison between the current produced in the strings of the devices you choose from the device selection and the current at the maximum power point and how many percent (%) deviation from the average is colored.
Attention: The average value in this table is calculated on the selected devices.
The colors of the deviation percentages (%) represent value ranges;
- Red color |> 10%|
- Yellow color |<= 10%|
- Green color |<= 5%|
Note: The selected strings are expected to have a green deviation from the mean when everything is OK in the system.