Overview
It is the page where the station, metrics, station information and production chart that you click on the home page are displayed in the selected time period.
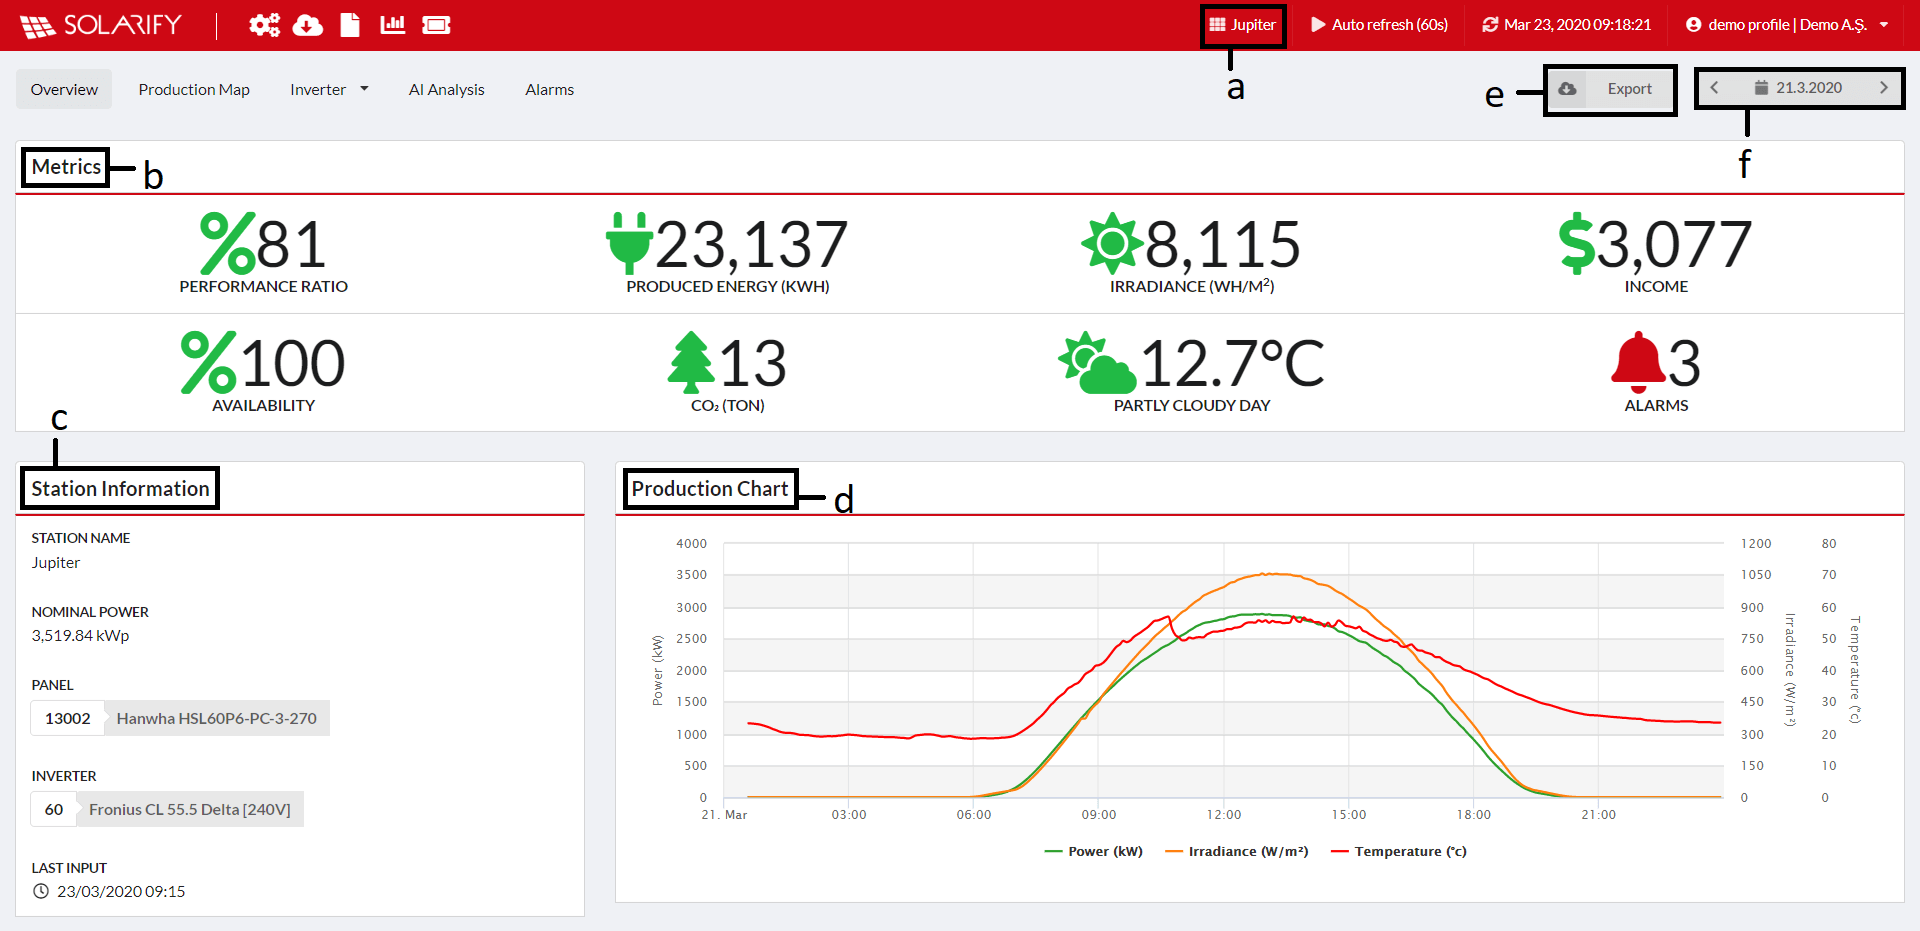
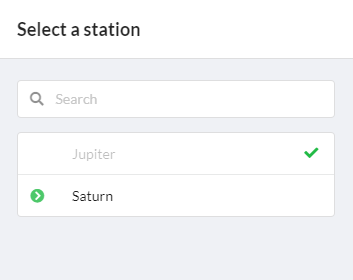
a) Select Station
Indicates which station is on the detail page. When you click on the button, it gives you the option to go to the detail page of a station you want.
b) Metrics
- Performance Ratio: It is the metric calculated according to IEC 61724-1. It is displayed as "-" in stations without radiation sensors. It is calculated cumulatively in the selected time period and is displayed as a percentage. The ratio of the PR value indicates how close the system is to its theoretical capacity in terms of performance.
-
TPR (Temperature Corrected Performance Ratio): Calculated according to
IEC 61724-1.
If you hover over the performance ratio with the mouse, you can see the TPR.
By accounting for temperature effects, it more accurately reflects the system's actual performance.
This is because, as temperature increases, the efficiency of PV modules decreases.
TPR shows how efficiently the system operates under real conditions, which is an important correction, especially in hot regions.
Displayed as a percentage.
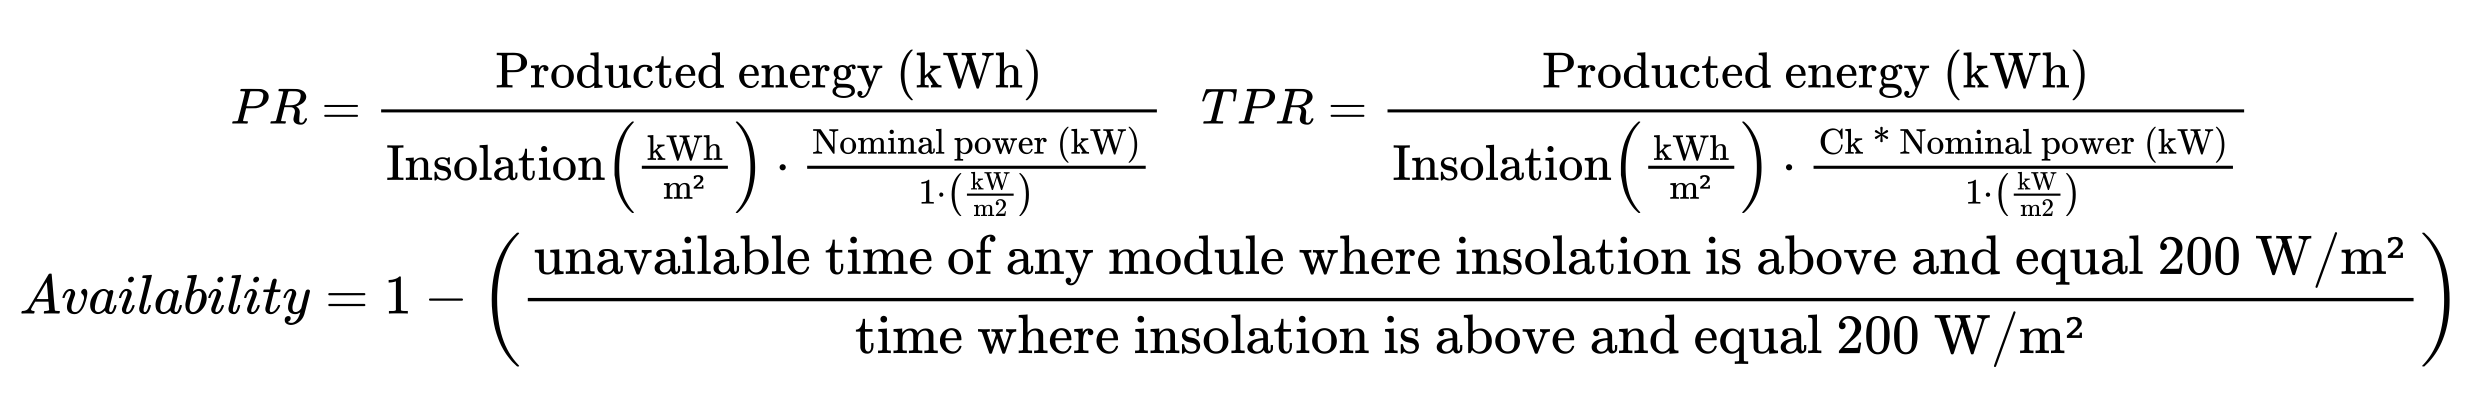
- Availabilty: Shows how long the plant has been active when the solar radiation is above a certain level. It is generally accepted that ideal conditions for solar energy production begin when the irradiation value exceeds 200 W/m². Therefore, when setting up the portal, the threshold value is assumed to be 200 W/m². Displayed as a percentage.
- Produced Energy [KWH]: It shows the cumulative amount of energy produced in the selected time period. It takes the production data from the term "STE", which we set in the terms section. The production point can be the inverter output or optionally the energy quality analyzer output on the medium voltage side.
- Irradiance [WH/M²]: It shows the amount of cumulative radiation measured in the selected time period. In case of more than one radiation sensor, it can be selected which sensor can receive data or the average of all sensors can be determined in the term "STI". Displayed as "-" in areas without radiation sensors.
- CO₂(TON): It calculates cumulatively the CO₂ emission that is blocked due to the energy produced during the selected time period.
- Alarms: Opens the screen that allows you to quickly see active alarms.
c) Stations Information
- Station Name: The name of the station.
- Nominal Power: It indicates the maximum power that panels of the power plant can produce according to standard test conditions.
- Panel: Panel type and number.
- Inverter: Inverter type and number.
- Last input: Shows when the most recent data came.
Note: Nominal power, panel and inverter information is taken from the information entered when creating a substation.
d) Production Chart
The area where you display the power, radiation and panel temperature values in a graphic form. It changes in the selected time period.
e) Export
Button for exporting production(kW), radiation(W/m²) and temperature(°C) information displayed according to the selected date in the overview screen.
f) Date
It allows you to view the Overview page on a daily, weekly, monthly and yearly basis.